


Chartcube: Data Presentation: Reporting, Analytics and Collaboration app for iPhone and iPad
Developer: Chartcube
First release : 05 Nov 2014
App size: 22.05 Mb
Data Presentation Reimagined – Instant, Mobile, Collaborative. Chartcube lets you create a data presentation instantly from a spreadsheet. You can add comments and share. The whole team can collaborate in real time. Delight your team with the power to slice & dice easily and discuss anytime, anywhere.
“Puts presentation in the hands of analysts.” -Forbes
"Converts spreadsheets into something readable." -Wired
"Slack for data." -TechCrunch
Features:
• Interact: Swipe to pivot, double tap to drill down, scroll over to see any value
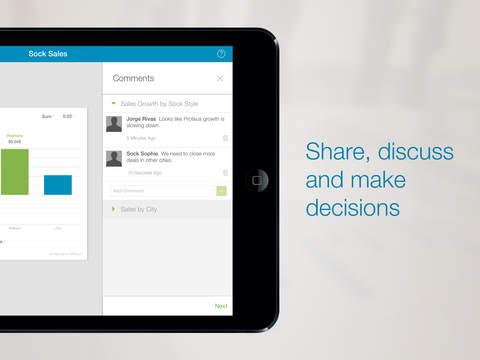
• Collaborate: Comment on each chart and share with others, even if they don’t have the app
• Get notified and reply via email. Your comments appear with that chart.
• Instantly create a cube from iPhone by emailing a spreadsheet to a unique email address. Simply upload a spreadsheet (Excel and CSV) on the web and iPad.
• Enjoy the mobile-first experience created to enable data collaboration on a small touch screen
• Be rest assured about security of your data
Chartcube can be used for any business data. Be it sales performance, retail metrics, marketing analytics, operations KPIs, or your executive dashboard. The data could come from BI tools, ERP systems, SaaS or the base sheets of your pivot tables.
What users are saying:
• “Helpful in quickly understanding and making sense of my data with zero effort.”
• “Fast, easy to use, and extremely useful for anyone who deals with Excel data regularly.”
• “Love this app. Makes it easy for me to visualize data and add comments, making data collaboration easy.”
We love feedback! Email us at [email protected] or tweet us @chartcubesays.